AI-Enhanced Monitoring with Grafana and CrewAI
Monitoring systems have come a long way in helping teams keep an eye on infrastructure. Tools like Prometheus, Grafana, and Alertmanager are great at collecting metrics, showing dashboards, and sending notifications when something crosses a threshold.
But alerts often stop at something is wrong. They do not always explain why it happened, what changed recently, or what the next step should be.
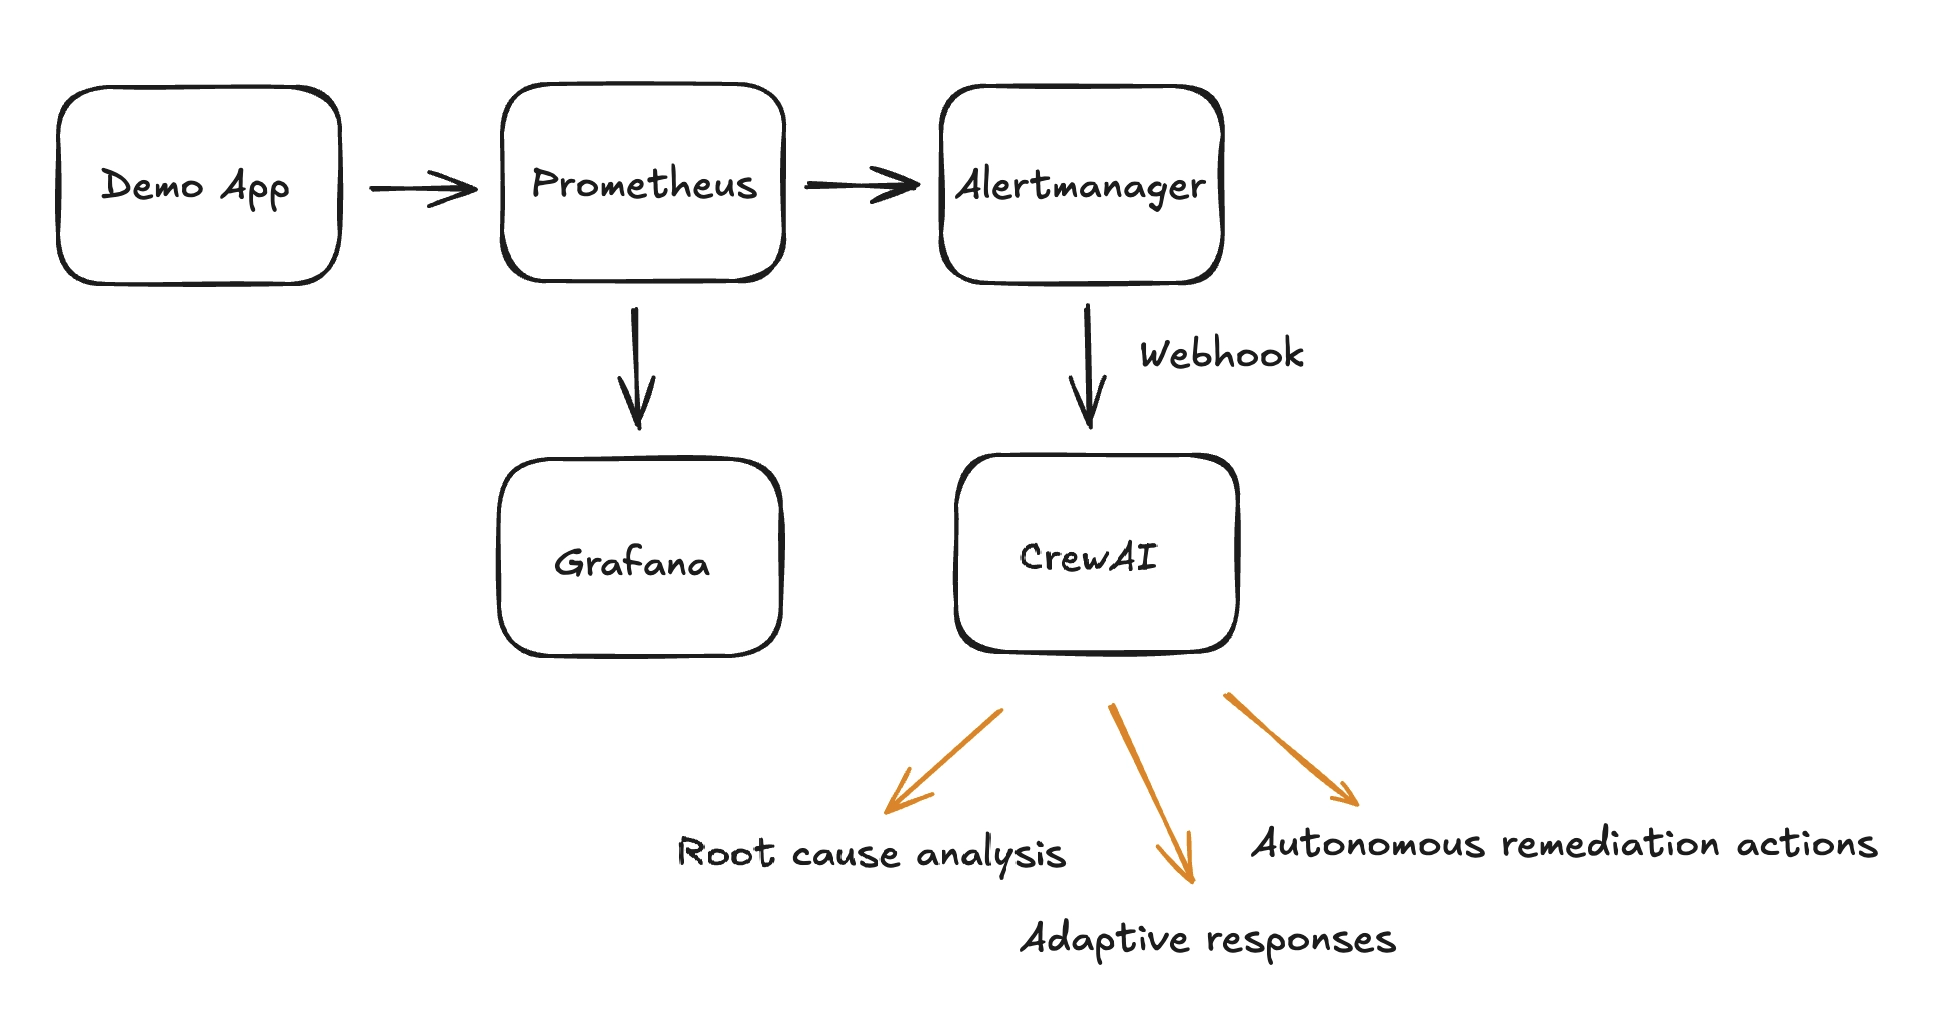
To explore that gap, I built a small proof of concept that connects Prometheus, Alertmanager, Grafana, and CrewAI. The idea was not to replace the monitoring stack, but to add an AI layer that can interpret alerts, add context, and produce a more useful incident summary.
What I Built
The prototype simulates a standard monitoring flow and adds CrewAI agents after Alertmanager receives an alert. It is intentionally lightweight, but it shows how AI can be woven into existing monitoring pipelines without changing the tools teams already rely on.
Why It Matters
Prometheus and Grafana are great at:
- Collecting and visualizing metrics
- Sending alerts when thresholds are breached
- Providing dashboards and notifications
On their own, they are less suited for:
- Correlating an alert with recent deployments or log patterns
- Understanding the potential business impact of downtime
- Suggesting safe remediation steps
- Learning from how similar incidents were resolved in the past
That is where AI can start to add value. Even small steps, such as letting an agent summarize the alert, inspect related metrics, and suggest next checks, can make raw alerts easier to act on.
The Role of AI Agents
For this experiment, I set up two basic agents inside CrewAI:
- Alert Analyzer: Reviews the incoming alert and adds context such as severity, likely causes, and recommended checks.
- Incident Responder: Produces a simple incident report with the alert summary, possible impact, and suggested next actions.
This could be extended further with agents that check log data, compare incidents against historical patterns, or prepare safe remediation actions for human approval.
What I Learned
Putting this MVP together taught me a few things:
- Integration matters: AI is only useful when it plugs into the workflows people already use.
- Start small: Even one or two simple tools, like querying recent metrics, can add meaningful context.
- Business impact matters: The goal is not just faster alert handling. It is reducing the impact downtime has on customers and operations.
Looking Ahead
This is still an early experiment. It could be extended by connecting to log systems, adding incident history, or introducing controlled remediation tools. Even in its basic form, it shows how monitoring can move from reactive notifications toward a more proactive support system.
If you are interested, here is the GitHub link to Grafana Monitoring.